Helika Explore
Description
Helika Explore is a data querying tool for power users in the Analytics section, that allows users to:
- Write, run, save and export custom SQL queries
- Visualize the output of the query in a custom graph
- Use these custom graphs to create dashboards that are shared with the whole team
Value
⭐️ Get a hands on experience analyzing data
⭐️ Be fast by running a quick ad-hoc query right when you need it
⭐️ Be flexible by adjusting your query on the go, when you need a slightly different result
⭐️ Experiment with the best way to visualize the results
⭐️ Share the most up-to-date results with the team
Helika Explore Sections
SQL Explorer
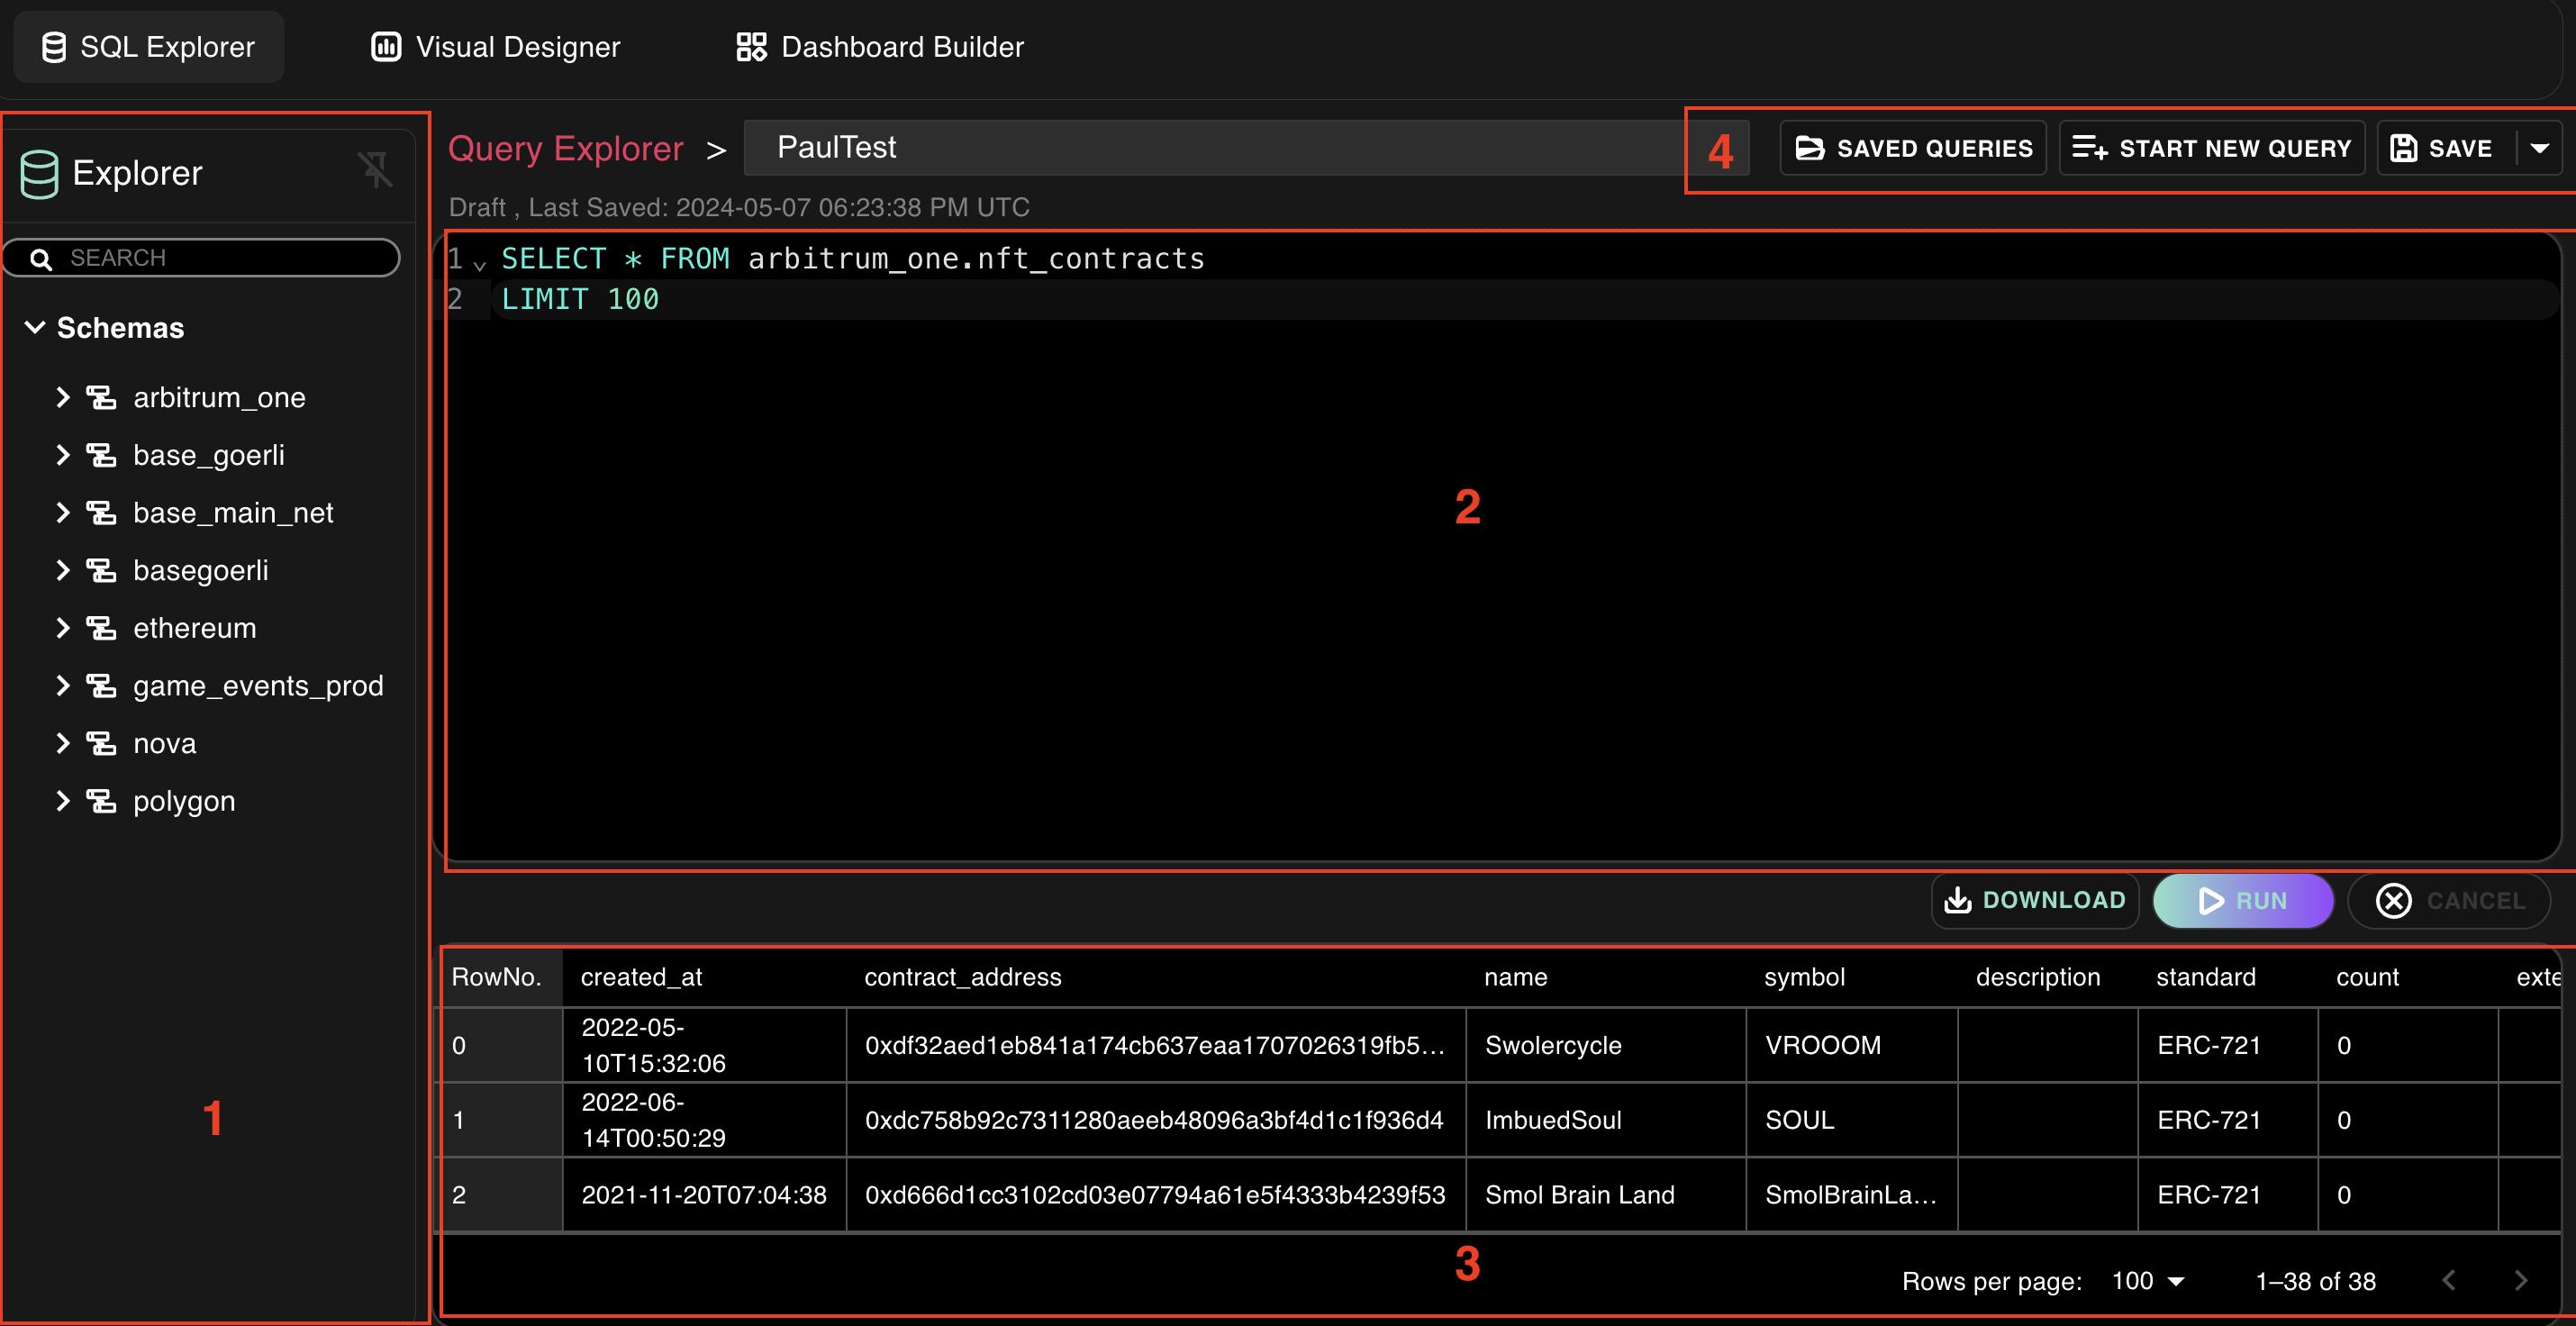
- Schemas - find the right property in the list of all available tables
- SQL Window - write your own query and run it
- Output window - see the results of your query
- Manage queries - open, save or clear the query in the SQL Window
Visual Designer
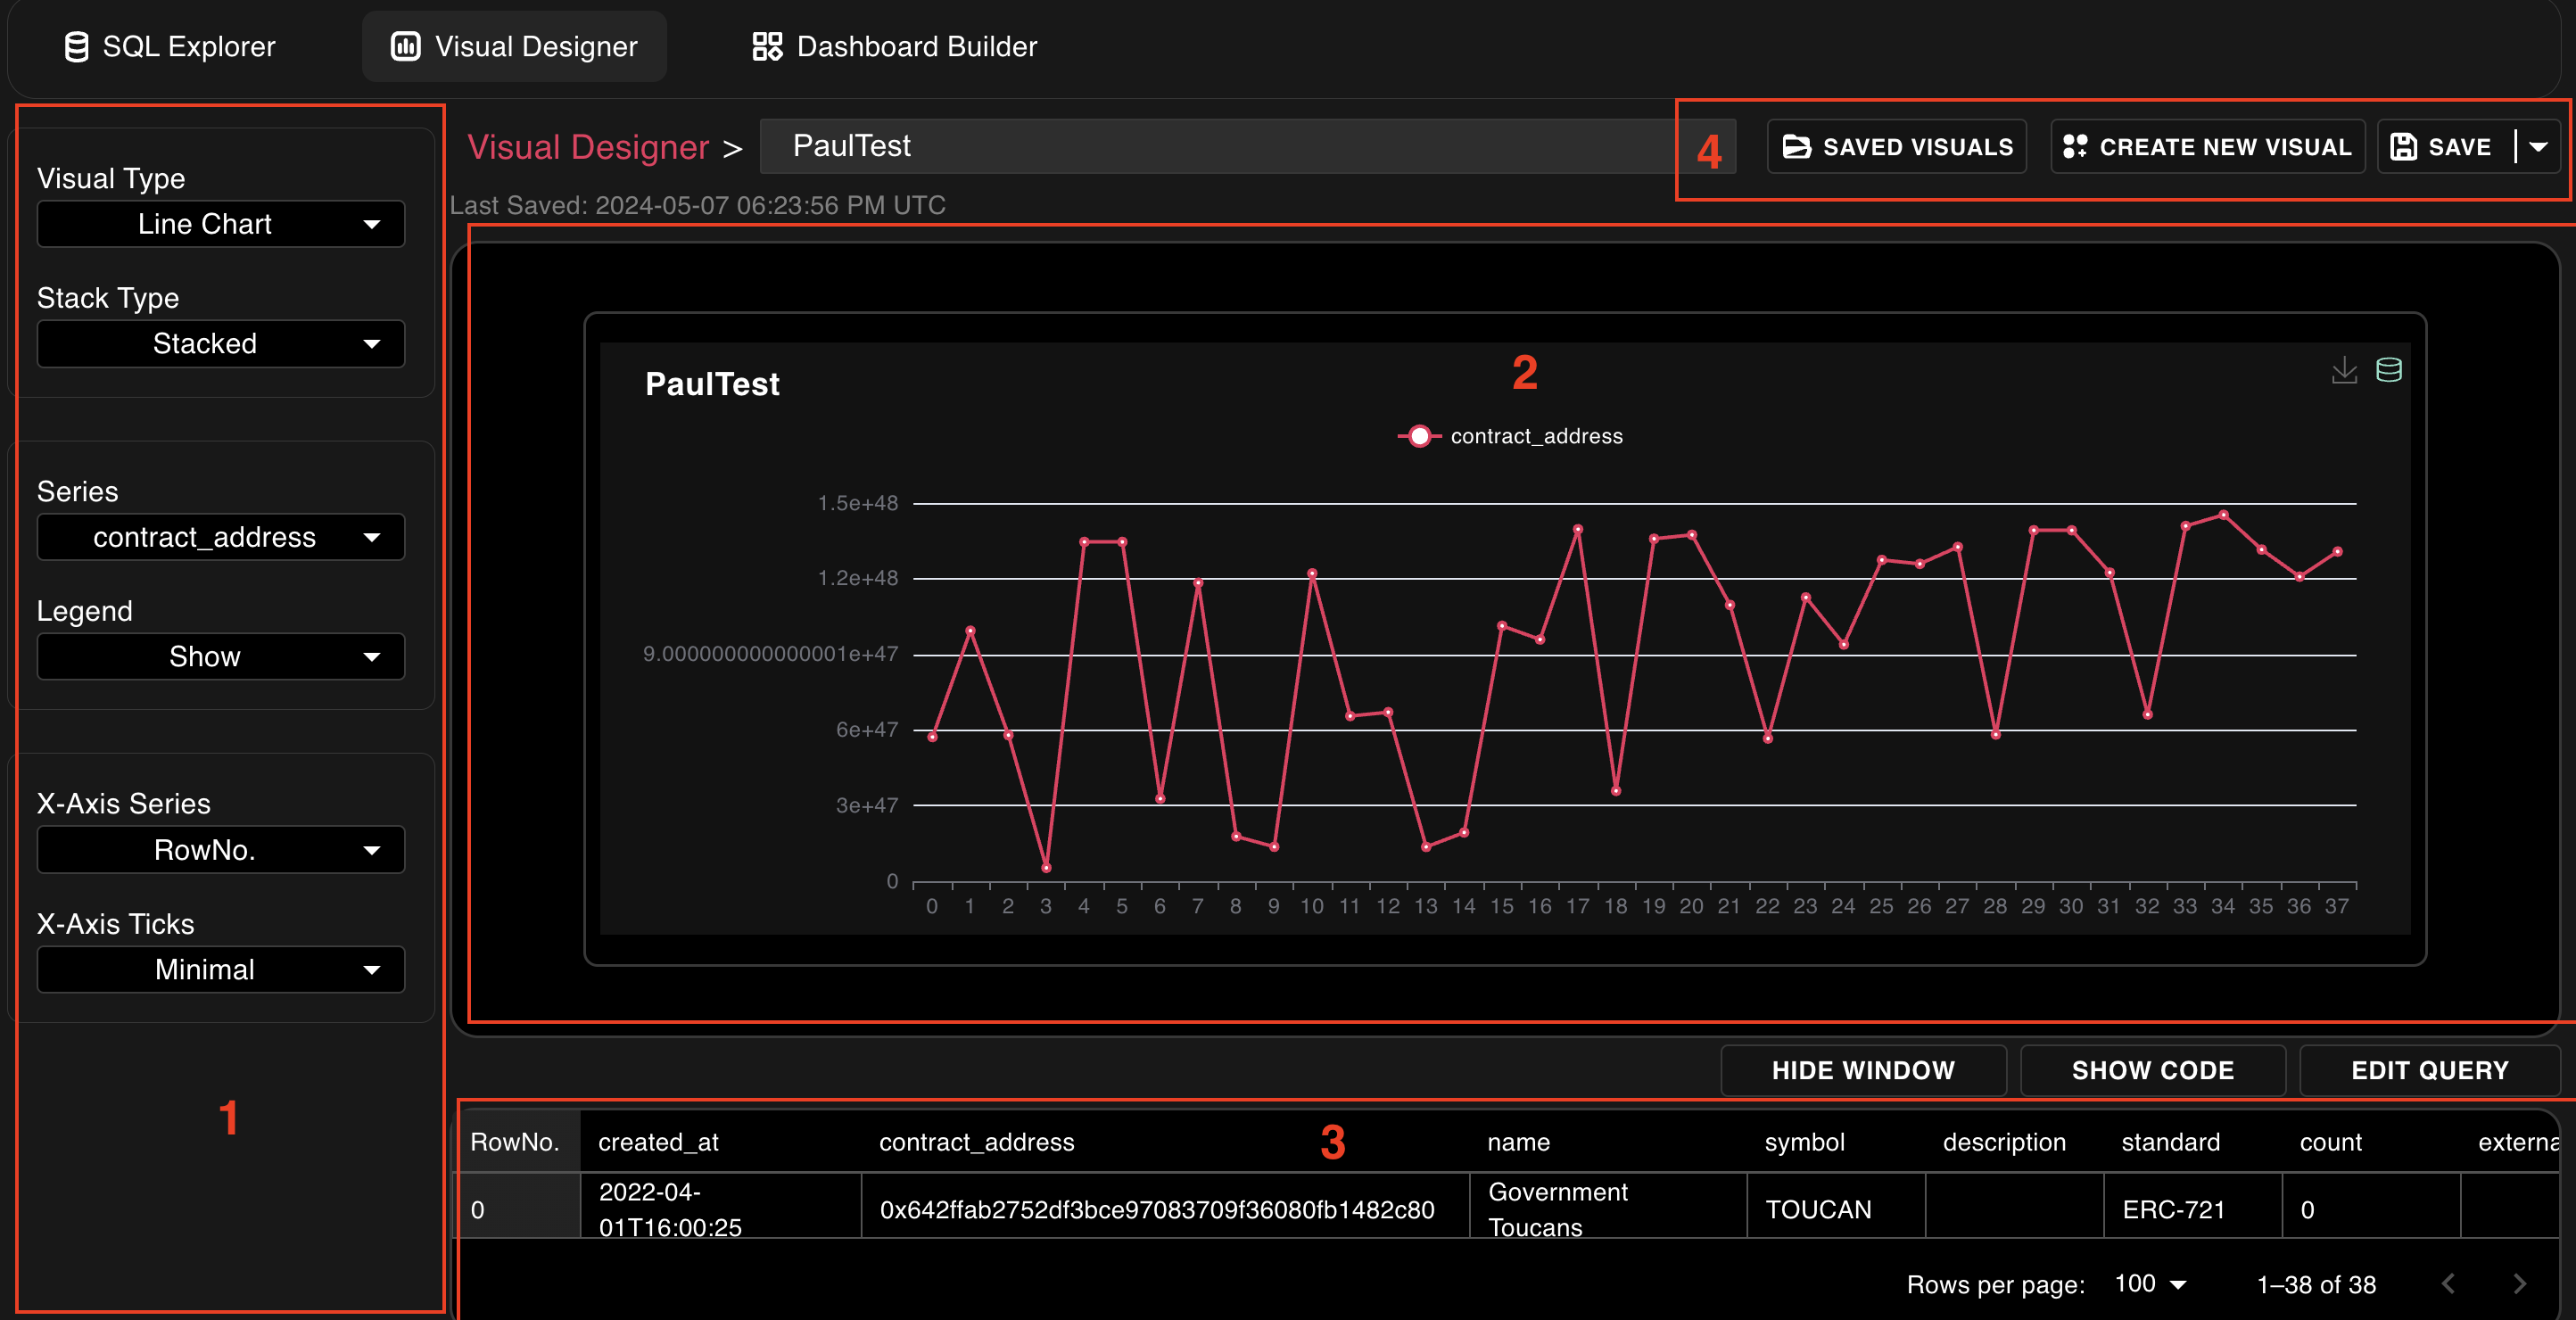
- Visual Setup - choose parameters for the current visual
- Preview Window - see the result of the visual
- Data preview - see the data you are visualizing or have a look and the original SQL query
- Manage the visuals - open, save or clear the visual in the Preview Window
Dashboard Builder
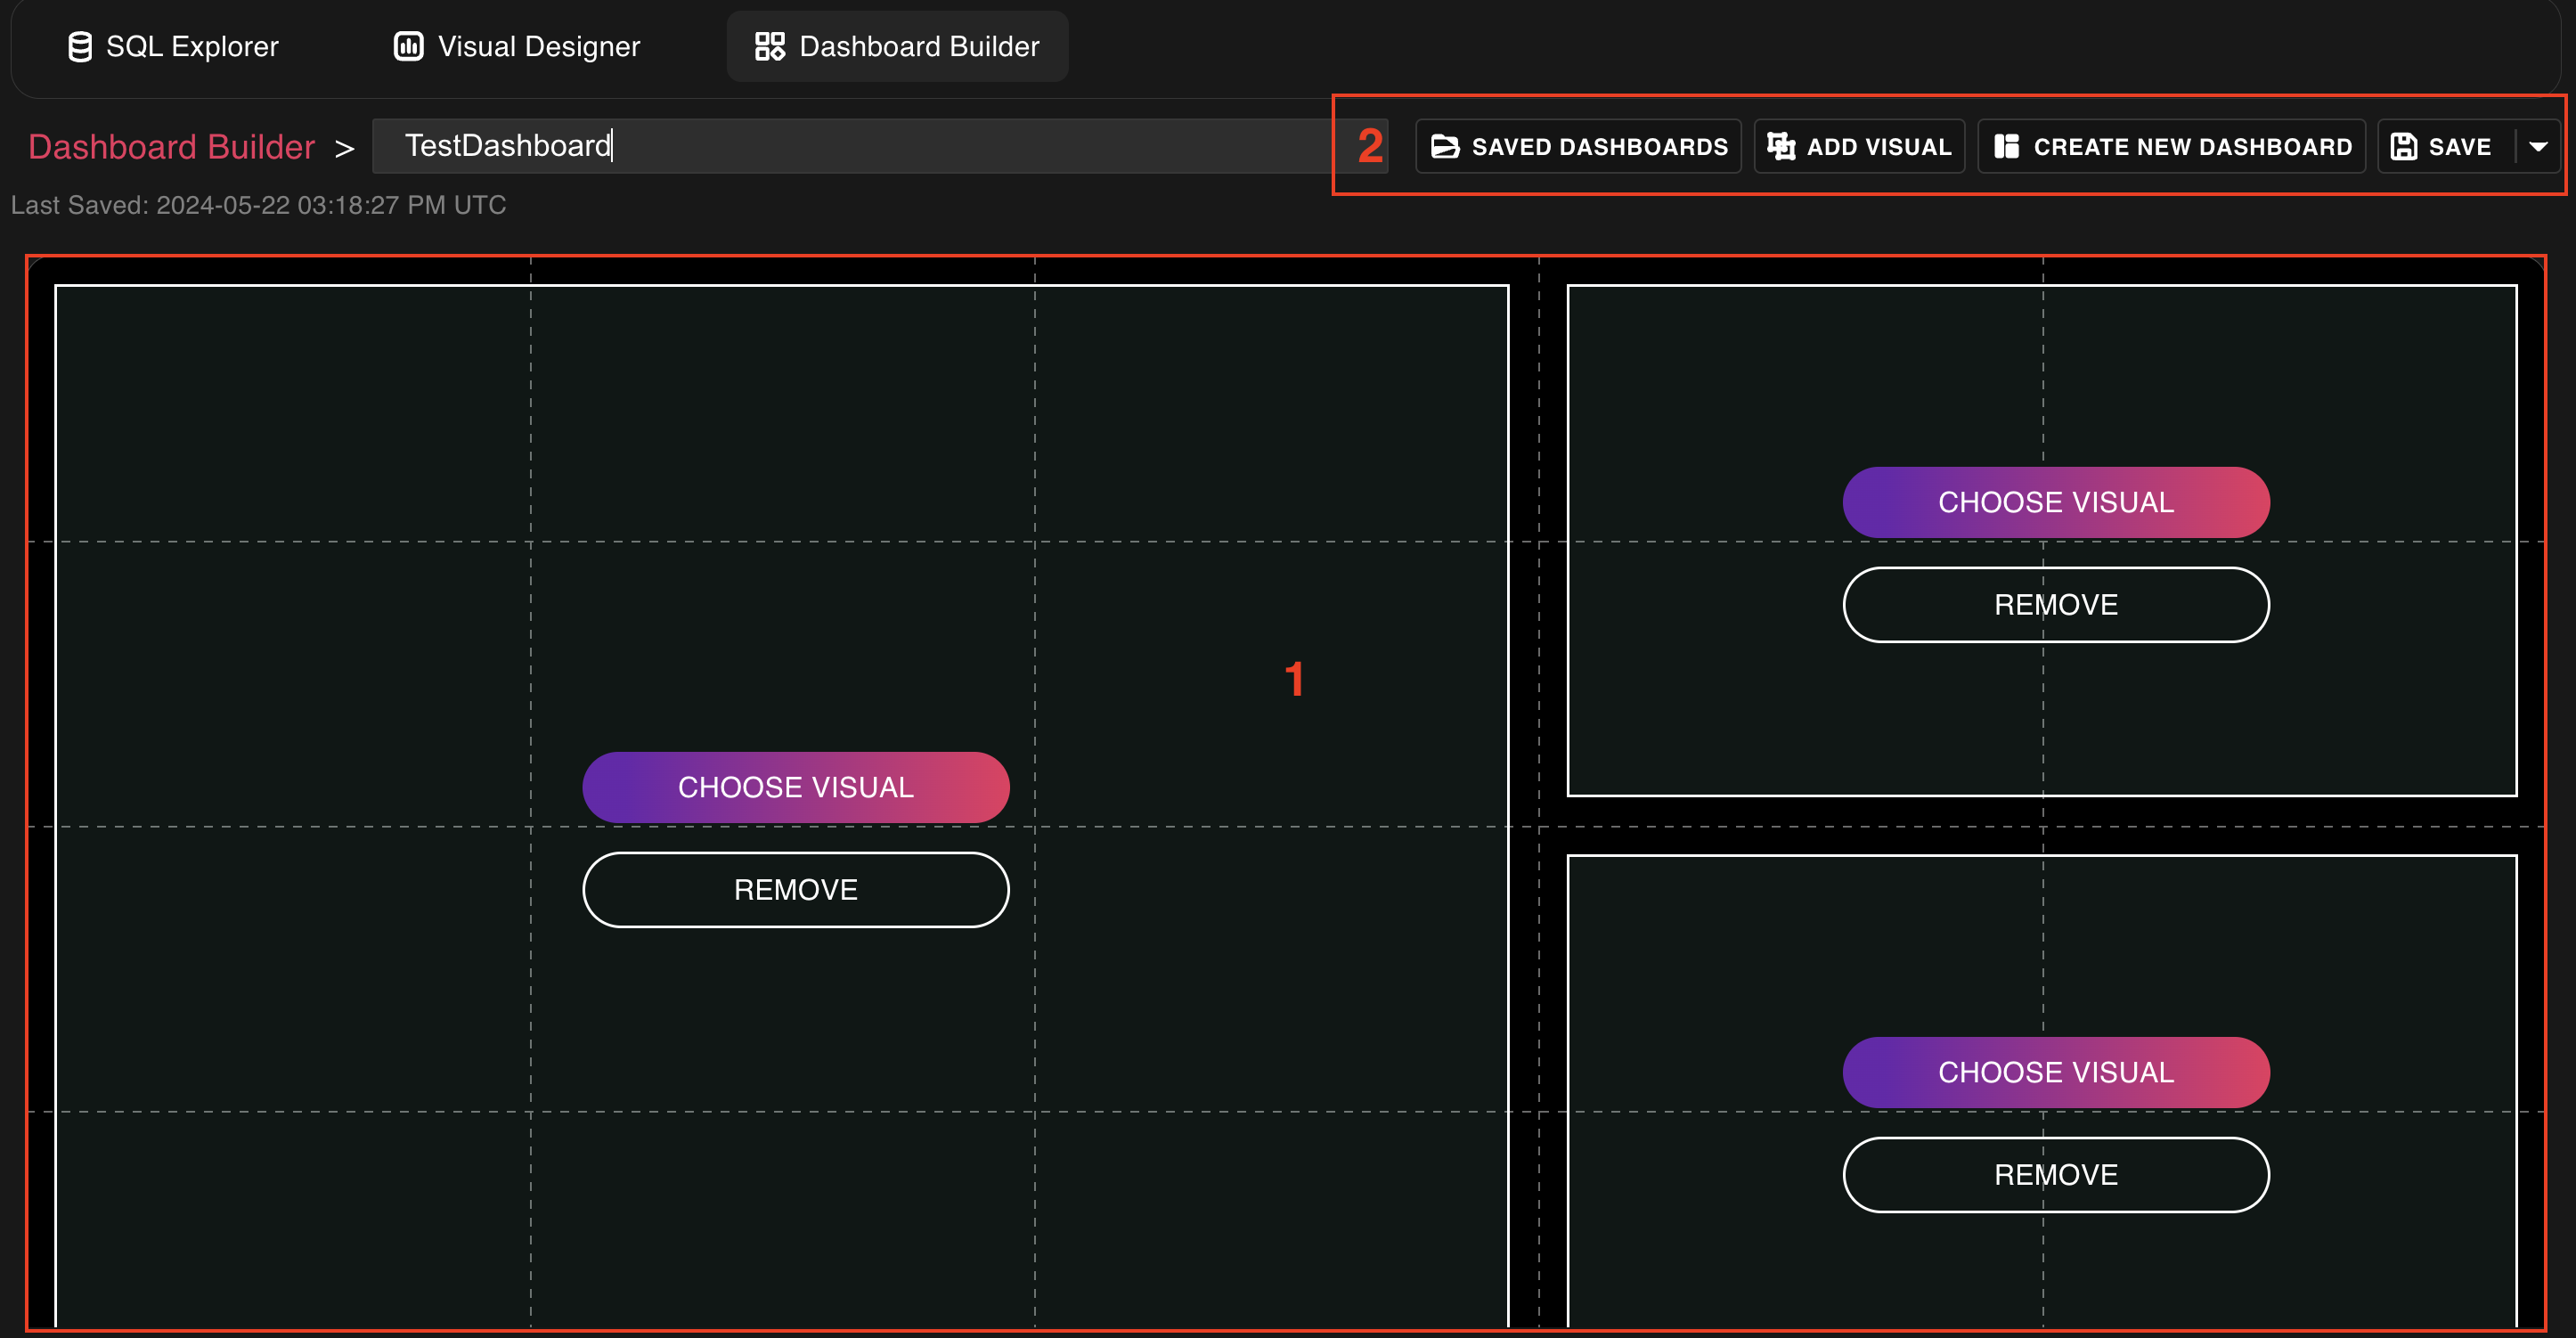
- Dashboard canvas - choose visuals for each block (blocks can be added from section 2), resize and move around blocks, build your own custom dashboard
- Manage dashboard - add blocks, open, save or publish the dashboard. Published dashboards will appear in the left menu in the CUSTOM section, accessible by your whole organization
Updated 14 days ago